Building a queue table's index around its live set
A partial index on a Postgres 17 queue table: 41 times smaller, a cliff on the generic plan, bloat under 15 minutes of churn, and an autovacuum that never came.

PostgreSQL · Measurement
Building a queue table's index around its live set
Single machine, Postgres 17, synthetic bench: a 30-second measurement, the planner, and 15 minutes of churn.
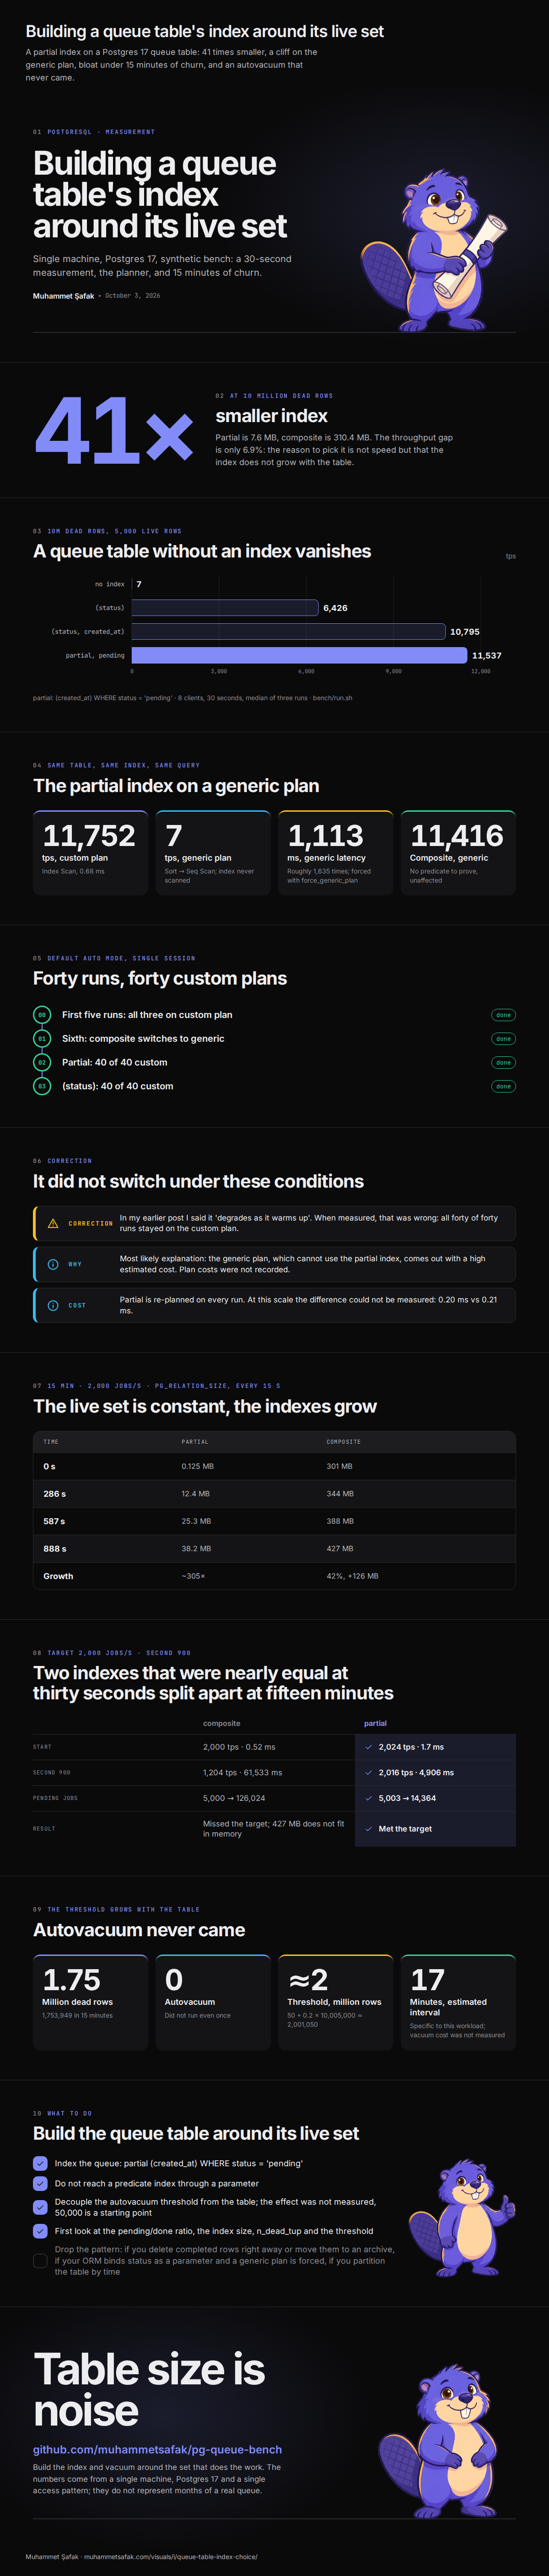
41×
At 10 million dead rows
smaller index
Partial is 7.6 MB, composite is 310.4 MB. The throughput gap is only 6.9%: the reason to pick it is not speed but that the index does not grow with the table.
10M dead rows, 5,000 live rows
A queue table without an index vanishes
tps
- no index7
- (status)6,426
- (status, created_at)10,795
- partial, pending11,537
Same table, same index, same query
The partial index on a generic plan
- 11,752tps, custom planIndex Scan, 0.68 ms
- 7tps, generic planSort → Seq Scan; index never scanned
- 1,113ms, generic latencyRoughly 1,635 times; forced with force_generic_plan
- 11,416Composite, genericNo predicate to prove, unaffected
Default auto mode, single session
Forty runs, forty custom plans
- First five runs: all three on custom plandone
- Sixth: composite switches to genericdone
- Partial: 40 of 40 customdone
- (status): 40 of 40 customdone
Correction
It did not switch under these conditions
- CorrectionIn my earlier post I said it 'degrades as it warms up'. When measured, that was wrong: all forty of forty runs stayed on the custom plan.
- WhyMost likely explanation: the generic plan, which cannot use the partial index, comes out with a high estimated cost. Plan costs were not recorded.
- CostPartial is re-planned on every run. At this scale the difference could not be measured: 0.20 ms vs 0.21 ms.
15 min · 2,000 jobs/s · pg_relation_size, every 15 s
The live set is constant, the indexes grow
| Time | partial | composite |
|---|---|---|
| 0 s | 0.125 MB | 301 MB |
| 286 s | 12.4 MB | 344 MB |
| 587 s | 25.3 MB | 388 MB |
| 888 s | 38.2 MB | 427 MB |
| Growth | ~305× | 42%, +126 MB |
Target 2,000 jobs/s · second 900
Two indexes that were nearly equal at thirty seconds split apart at fifteen minutes
| composite | partial | |
|---|---|---|
| Start | 2,000 tps · 0.52 ms | 2,024 tps · 1.7 ms |
| Second 900 | 1,204 tps · 61,533 ms | 2,016 tps · 4,906 ms |
| Pending jobs | 5,000 → 126,024 | 5,003 → 14,364 |
| Result | Missed the target; 427 MB does not fit in memory | Met the target |
The threshold grows with the table
Autovacuum never came
- 1.75Million dead rows1,753,949 in 15 minutes
- 0AutovacuumDid not run even once
- ≈2Threshold, million rows50 + 0.2 × 10,005,000 ≈ 2,001,050
- 17Minutes, estimated intervalSpecific to this workload; vacuum cost was not measured

What to do
Build the queue table around its live set
- Index the queue: partial (created_at) WHERE status = 'pending' (done)
- Do not reach a predicate index through a parameter (done)
- Decouple the autovacuum threshold from the table; the effect was not measured, 50,000 is a starting point (done)
- First look at the pending/done ratio, the index size, n_dead_tup and the threshold (done)
- Drop the pattern: if you delete completed rows right away or move them to an archive, if your ORM binds status as a parameter and a generic plan is forced, if you partition the table by time (pending)

Table size is noise
Build the index and vacuum around the set that does the work. The numbers come from a single machine, Postgres 17 and a single access pattern; they do not represent months of a real queue.