64 goroutines on four cores: Mutex and channel run at the same speed, but the Mutex's p99 is five times higher
When G goroutines on P cores hammer the same shared counter, how many operations a second do sync.Mutex, an owner-goroutine channel and a buffered channel manage, and how do tail latency and fairness of waiting change?
Finding
With 64 goroutines on four cores, sync.Mutex and a one-way channel run at the same speed (7.69 and 7.94 million operations/s) but the Mutex's p99 wait is 5 times higher. On eight cores the Mutex is 2.4 and 4.0 times faster (15.96 million operations/s; the channels 6.65 and 3.97 million); the ratios come from unflagged cells.
- G=64 P=4 · p99 wait, Mutex → one-way channel
- 491,519 → 98,303 ns
- G=64 P=8 · Mutex
- 15.96 million operations/s
- G=64 P=8 · one-way channel
- 6.65 million operations/s
- Cells carrying a quality flag
- 518 / 845
Method
go-sync-bench measured three patterns: S1 single counter (sync.Mutex, a one-way channel to an owner goroutine, a request-reply channel, atomic), S2 read ratio (Mutex, RWMutex, owner-goroutine channel), S3 producer-consumer queue (channel buffers of 0, 1, 64, 1024 and a queue built on sync.Cond). Each cell, per G goroutines and P core group (1, 2, 4 and 8 via cpuset), ran 5 rounds; each repetition had a 0.5 s warm-up, a 1.5 s throughput window and a 2.0 s latency window. 845 cells, 4,225 valid repetitions. After every round × core group container came a 60 s cooldown, in a network-less, read-only Docker container with 4 GiB of memory. Cell medians were taken from all 5 repetitions; no repetition was discarded. Flag thresholds are 10% for throughput, 25% for p99 and 5% for clock drift, over the full range. When picking rerun candidates, the most extreme repetition was dropped and the remaining range examined (throughput 10%, p99 50%); the first design's trigger selected 294 candidates, which exceeded the 84-cell budget, so this rule was used and 88 cells were rerun (2026-09-30 01:38-02:31 UTC). 518 of the 845 cells are flagged, so confidence is low. Latency percentiles are upper bounds of log buckets and are sampled at 1/16; the floor is 164 ns, 4 times the clock resolution.
- Measured on
- Published
measured 5 days ago
Environment
- Go
- 1.27.1 · linux/arm64
- Virtualization
- Docker Engine 29.8.0 · 12 vCPU · aarch64
- Hardware
- Apple M4 Pro · 12 CPU
- Core groups
- P1 = 4 · P2 = 4-5 · P4 = 4-7 · P8 = 4-11 (cpuset)
- Container
- network-less · read-only · 4 GiB memory
- Image
- first pass sha256:640a046f219a… · rerun sha256:eabc1573265a…
- Protocol
- 5 rounds · 845 cells · 0.5 s warm-up + 1.5 s throughput + 2.0 s latency · 60 s cooldown (per container)
- Seed
- 932269622
Technologies
To reproduce
./bench/verify.sh && STAMP=$(date -u +%F) ./bench/run.sh --allWhen I pointed 64 goroutines at the same counter on four cores, sync.Mutex
and a channel did the same number of operations a second: 7.69 and 7.94
million. In the same cell the p99 wait was 491,519 ns against 98,303 ns. That
pair is where I saw that “which one is faster” has no single answer; this
record writes down what that answer depends on, as far as I measured it. All
the code and the raw runs are in the
go-sync-bench repository.
For a practical walk-through of goroutines and channels, see Concurrency in Go: goroutines and channels in practice. Here there is only measurement.
What I measured
The main pattern (S1) is this: G goroutines increment a single shared counter. There are four ways to reach the counter.
| Model | Access style |
|---|---|
| Mutex | Counter protected by sync.Mutex |
| One-way channel | A single owner goroutine holds the counter; the others send requests to the channel and do not wait for a reply |
| Request-reply channel | The same owner goroutine, but each request carries a reply channel and waits for the answer |
| atomic | Atomic increment; for context only, not part of the headline claim |
Two more patterns ran: in S2 the read ratio varies (50, 90 and 99 percent
reads), and in S3 a producer-consumer queue is tried with different buffers
(channel 0, 1, 64, 1024 and a queue built on sync.Cond). The core count P is
the size of the core group given to the container via cpuset: 1, 2, 4 and 8.
In this record “operations/s” is the median of a throughput window, and “wait” is the time it takes an operation to reach the counter during the latency window. Latency percentiles are reported as upper bounds of log buckets; so numbers like 491,519 are the ceiling of a bucket, not an exact measured value.
64 goroutines, four cores: same speed, different tail
| Model | Operations/s | p50 | p99 | p99.9 |
|---|---|---|---|---|
| Mutex | 7,688,545 | 639 ns | 491,519 ns | 1,441,791 ns |
| One-way channel | 7,944,446 | 175 ns | 98,303 ns | 114,687 ns |
The throughput difference is 3.3 percent in the channel’s favor, so within noise. The wait difference is not noise: 639 against 175 at p50, 491,519 against 98,303 at p99, 1,441,791 against 114,687 ns at p99.9. The Mutex produces the same total with a wider distribution. A benchmark that looks at the average would have seen these two models as equal.
I did not measure why it is this way. I could build an explanation of how the Mutex wakes its waiting goroutines, but it would not be evidence this experiment produced; I am leaving it out of the text.
On eight cores the table turned
G=64: throughput on four and eight cores
The Mutex nearly doubled on eight cores while the one-way channel fell back. The request-reply channel's P=4 cell carries a quality flag and stayed out of the chart; its P=8 value is in the table below.
- Mutex
- One-way channel
M Source: go-sync-bench, results/2026-09-29/merged/summary.json, S1 cells
Data table
| Series | P=4 | P=8 |
|---|---|---|
| Mutex | 7.69 M | 15.96 M |
| One-way channel | 7.94 M | 6.65 M |
The chart is drawn in the browser; the table below carries the same data.
| Model | Operations/s (P=8) | Mutex ratio | p99 |
|---|---|---|---|
| Mutex | 15,962,148 | 1.00 | 114,687 ns |
| One-way channel | 6,648,606 | 2.40 | 122,879 ns |
| Request-reply channel | 3,970,457 | 4.02 | 131,071 ns |
The Mutex sped up 2.08 times from P=4 to P=8. The one-way channel dropped to 0.84 of its earlier value: a single owner goroutine holds the counter; I don’t know what adding cores contributes to it. The experiment did not measure the cause; I am not even offering a hypothesis.
At P=8 the p99 is close across all three models: 114,687, 122,879 and 131,071 ns. The fivefold gap at four cores is not visible here. The question of which model’s tail is “better” has no single answer; it depends on P.
What I have to leave out of scope: the Mutex cell at P=1 (63.10 million)
carries the spread_persistent and observer_effect flags, and the one at
P=2 (13.22 million) is flagged. I did not take either into the claim. I also
can’t say whether the Mutex curve is monotonic in P, because the P=1 and P=2
cells are flagged.
10,000 goroutines: the Mutex is fast, its unfairness is unexplained
| Model | Operations/s | Jain | p99 | Flag |
|---|---|---|---|---|
| Mutex | 14,878,958 | 0.8237 | 27,262,975 ns | fairness_unexplained |
| One-way channel | 2,052,681 | 0.9999 | 5,767,167 ns | none |
| Request-reply channel | 1,778,745 | 1.0000 | 6,291,455 ns | none |
Here the Mutex is 7.25 and 8.36 times faster than the channels. But the Jain
fairness index is 0.8237 and that value is flagged: fairness_unexplained.
The harness can tie unfairness to only one of two sources: parking behavior
(sync). The rule is this: if G ≤ P, if the per-goroutine time-slice bound b
≥ 1, or if at least half of the sampled acquisitions exceed the parking
threshold, the source is sync, otherwise unexplained. In this cell
G=10,000 > P=8, b = 0.12 and the share of slow acquisitions is only 0.0176; since none
of the three conditions holds, the unfairness could not be tied to parking
behavior. The rule does not look at the Jain value. The expected Jain the
harness computes from b is 0.12 (expected_quantum_jain), the measured one
0.8237; I have not verified the quantum model this calculation rests on, so I
am not attributing anything to the scheduler. I cannot trace the Mutex’s
unfairness to a cause. By my design rule these cells do not enter the
fairness comparison across models; in the table I am not saying “the Mutex is
more unfair”, I am saying “its unfairness is unexplained”.
The context of the same table: on four cores the Mutex’s Jain value is 0.4064
at G=1,024 and 0.1892 at G=10,000, both fairness_unexplained. In the channel
cells the Jain values at G=10,000 and P=8 are 0.9999 and 1; at the same G and
P=4 the one-way channel’s Jain is 0.7995 (from the rerun), so the channels’
fairness depends on P as well.
Read ratio and queue buffer
In S2 the Mutex speeds up as the read ratio rises; the owner-goroutine channel barely moves.
S2, G=64, P=4: throughput by read ratio
The Mutex is unflagged. The channel's 90 percent read cell comes from the rerun, and its 99 percent read cell carries the spread_throughput flag. The RWMutex cells are flagged observer_effect and are not in the chart.
- Mutex
- Owner-goroutine channel
M Source: go-sync-bench, results/2026-09-29/merged/summary.json, S2 cells
Data table
| Series | 50% reads | 90% reads | 99% reads |
|---|---|---|---|
| Mutex | 9.86 M | 12.23 M | 13.12 M |
| Owner-goroutine channel | 4.42 M | 4.58 M | 4.5 M |
The chart is drawn in the browser; the table below carries the same data.
At 50 percent reads the Mutex is 2.23 times the channel, at 90 percent 2.67 times. I am not writing the ratio for the 99 percent cell because it is flagged. The Mutex’s speed at 99 percent is 1.33 times its speed at 50 percent.
In S3, at G=64, P=4: the unbuffered channel does 5,414,190, the channel with a
buffer of one 6,912,398, and the sync.Cond queue with a buffer of 1,024
4,461,277 operations/s. These three cells are unflagged: when the buffer goes
up to one, the channel is 1.28 times faster, and 1.55 times faster than the
sync.Cond queue. The channels with buffers of 64 and 1,024 and the
sync.Cond cell with a buffer of 64 are flagged; numbers like 18.72 and 21.98
million only show direction, and I did not derive ratios.
Conclusion
How I measured
The experiment ran 845 cells; each cell 5 rounds, each round with a 0.5 s
warm-up, a 1.5 s throughput window and a 2.0 s latency window per repetition.
4,225 valid repetitions in total. The median duration of a repetition is 4.38
s; eight repetitions exceeded the budget (for example
s1-atomic-g10000-p4-w0 at 55 s). After every round × core group container
there is a 60 s cooldown; there is no wait between cells inside a container.
The container is network-less and read-only, with 4 GiB of memory. The first
pass had no sleep gate; the host machine slept once: in the 11:45-11:59 UTC
window, round 3 of the s1-chan_oneway-g64-p1-w0 cell was affected by this
and that cell is not part of the claim. Before the rerun, a sleep 0 check
was added to run.sh.
The results come from two passes. The first pass started at 2026-09-29T08:34:54Z
with the sha256:640a046f219a… image. The first design’s rerun trigger
selected 294 candidates (290 had failed the deviation gate, 11 a second gate;
one cell can fail both). That exceeded the 84-cell budget. The trigger was
changed to a trimmed range: the most extreme repetition is dropped and the
remaining range examined (10% for throughput, 50% for p99), and this only
selects which cell is rerun. The budget was raised from 84 to 88; the 88 cells
were rerun with the sha256:eabc1573265a… image at 2026-09-30 01:38-02:31
UTC. In the merged table the source shows rerun; 36 of them stayed above the
threshold even after the rerun. The cell median is still taken from all 5
repetitions. The flag is a separate criterion: over the full range, 10% for
throughput, 25% for p99, 5% for clock drift.
Quality flags:
| Flag | Cell count | Meaning |
|---|---|---|
| observer_effect | 171 | The operation rate in the latency window is below 0.9 of the throughput window's; the measurement is affecting itself |
| fairness_unexplained | 235 | Unfairness cannot be tied to parking behavior: G > P, b < 1 and fewer than half of the sampled acquisitions are above the parking threshold; the Jain value is not looked at |
| spread_p99 | 189 | Spread of p99 across repetitions above 0.25 |
| spread_throughput | 125 | Spread of throughput across repetitions above 0.10 |
| calib_drift | 72 | Clock calibration drifted by more than 0.05 |
| spread_persistent | 36 | Spread persists even after the rerun |
Noise floor: for P=2, atomic at G=2 has a Jain of 0.9999, for P=4 at G=4
0.9998, for P=8 at G=4 0.9997. So the measurement setup does not distort
fairness on its own. The self-test run passed 40 of its 40 trials. The
publishing command is in the reproduce field; the raw data and the license
(MIT) are in the repository.
Limits and honesty notes
- A majority of flagged cells. 518 of 845 cells are flagged. I took the throughput and p99 ratios in the headline from cells that carry none of these flags; the G=10,000, P=8 Mutex cell carries only the fairness flag. Where flagged cells are mentioned to show direction, they are labeled as such.
- vCPUs inside a VM. The measurement ran in a Docker virtual machine; the P/E core split is not visible from the VM and the cluster clock depends on the number of busy cores. P values are not physical cores but groups of vCPUs given via cpuset.
- P=2 is noisy. I could not verify why.
- The fairness flag’s rule. The flag looks at G, P, b and the parking
share; it cannot tell scheduler-caused unfairness apart. I did not verify
the quantum model (
expected_quantum_jain) and did not use it in the explanations. - Latency resolution. Latency percentiles are upper bounds of log buckets
and are sampled at a rate of 1/16.
< 164 nsis the floor, 4 times the clock resolution. I did not use thestarving_fractionfield because the sample count is small. - The request channel is unbuffered. A buffered request channel could change the result of the channel models.
- Two goroutines at G=1. The owner-goroutine models run 2 goroutines at G=1.
- Out of scope.
sync.Mapwas not measured at all; atomic was not measured in S2 either. A synthetic counter was measured, not a production workload.
To produce your own number, run the go-sync-bench repository on your own hardware; choose P according to your own target, because the clearest result of this record is that the answer depends on P.
Related posts

Concurrency in Go: goroutines and channels in practice
A hands-on look at Go's concurrency model — goroutines and channels — and what changes when you come from PHP's process model.
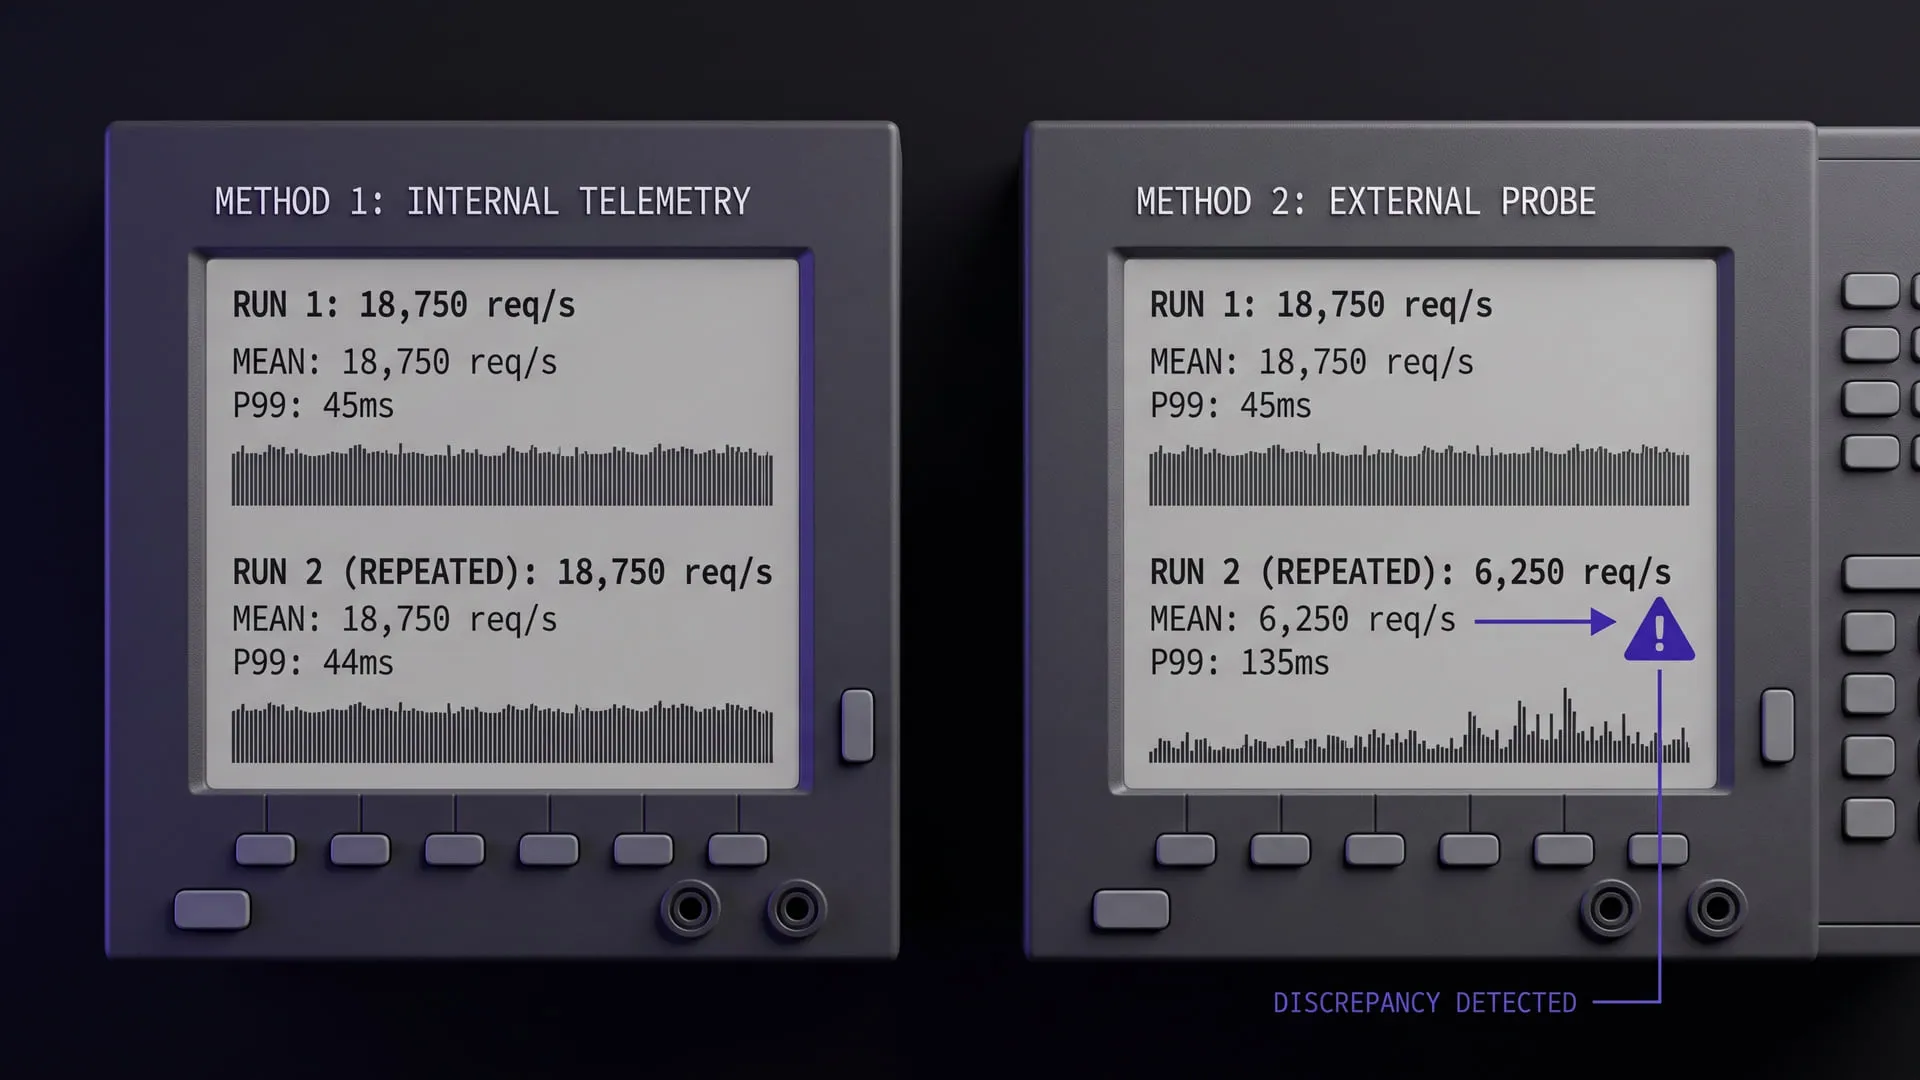
18,750 req/s: precise, repeated, and three times wrong
Two phases of the same run measured the same service three times apart. What caught the wrong one was not a better statistic but a second method.